About the Charts
C&GS 5112 · 5101 · circa 1965–70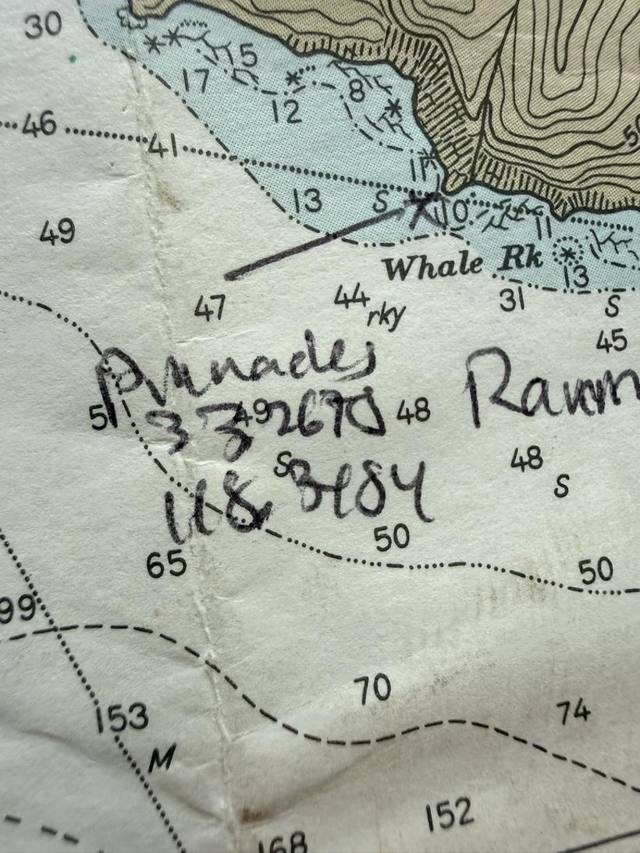
This site is drawn from a real set of U.S. Coast & Geodetic Survey charts of these waters — chart 5112 (Santa Catalina Island) and 5101 (San Diego to Santa Rosa Island), printed in the LORAN era of the mid‑1960s and worked hard ever since. The buff land tint, the soundings, the chart magenta, the italic water names: all of it comes from those sheets.
Decades ago, a diver who knew this coast marked his spots on them in pen — Pinnacles with its coordinates written right on the water, Ramming Rock, an arrow drawn out to Whale Rock, Farnsworth Bank circled on Catalina’s backside. Those marks are why the dive spots on our chart are drawn in handwriting: they were handed down that way.
That’s what a chart is for. The official survey underneath, and local knowledge written over the top. SoCal Channel Crossing works the same way — live forecast data underneath, a waterman’s rules of thumb written over it: the 8-knot line, the long-period pass, morning glass-off, the lee that flips to the south side when a Santa Ana blows.
His story is coming to this page.
The originals
The full-resolution scans of these retired chart editions are public domain, preserved in NOAA’s Historical Map & Chart Collection. Their modern successors — NOAA 18757 (Santa Catalina Island) and 18740 (San Diego to Santa Rosa Island) — are the ones to navigate by.